Global Credit Analysis (GCA) is a research and advisory platform built around a single thesis: disruption has become a primary market factor in credit, and the analytical infrastructure used to price, allocate, and risk-manage debt was calibrated for a world that no longer exists. For four decades, credit valuation rested on the assumption that cyclical beta — risk was approximately normally distributed, the security market line sloped monotonically upward, diversification reliably reduced portfolio variance, and impairment was a triggering event and needed to be managed. The frameworks that codified those assumptions — KMV/Merton (1974), Altman Z-Score (1968), Gordon-growth DCF (1959), CECL/IFRS 9 lifetime PD — were built before secular factors: innovation, energy transition, and demographic inflection became simultaneous, non-linear, and reinforcing.
GCA exists to advance the analytical tools combining Beta as the driving risk along with an infrastructure for the disruption era — and to deliver it as an ongoing framework, tools, and advisory to institutional credit allocators, insurance, investment offices, rating agencies, other institutions where credit is pivotal to their mandate, in collaboration with academic partners and an advisory panel of industry experts with operating and financial deep experience.
Why Disruption Is a Credit Problem, Not Just an Equity Problem
Equity factor models have already integrated disruption — extending the Fama-French 5-factor model (beta, size, value, momentum, profitability) to six factors by adding disruption. Credit has not. The asymmetry matters: equity captures the upside of disruption (disruptor multiples), while credit absorbs the downside (disrupted-incumbent default). Yet the credit decision stack — from strategic asset allocation to individual covenant design — still prices cyclical beta as if it were the only systematic factor that matters.
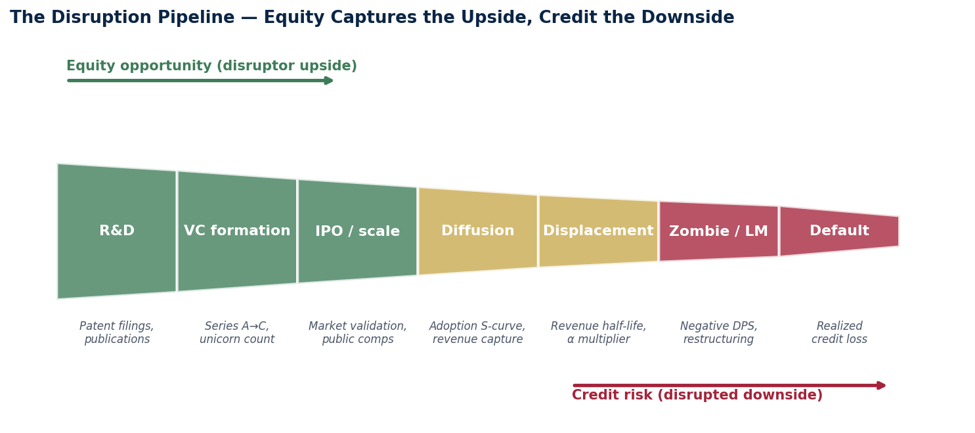
Figure 1 · The disruption pipeline. Equity captures the upside (R&D → IPO). Credit absorbs the downside (displacement → default). GCA models each stage explicitly.
What GCA Delivers
GCA provides an integrated analytical toolkit spanning the full credit decision stack. Every output is anchored on peer-reviewed academic literature and reputable market data with quarterly sector-level recalibration.
Toolkit by use case
Strategic asset allocation — Security-market-line reweighting under disruption; risk-premium estimates that internalize bimodal return distributions across cash, IG, HY, leveraged loans, private credit, CLO, public/private equity, infrastructure, commodities.
Sector and sub-sector relative value — Disruption-adjusted spreads for 24 HY/LL sectors; α multipliers calibrated to ICE BofA HY sub-indices; sector-correlation overlays for portfolio construction.
Portfolio construction and risk management — Tail-VaR adjustment, CECL/IFRS 9 disruption overlays, sovereign-corporate decoupling in EM, jump-process scenarios (carbon, AI Act, technology cliffs).
Individual credit underwriting — Six-framework composite (accelerated depreciation, real options, DCF terminal value, revenue half-life, reduced-form hazard, Tobin's Q + intangibles) generating fair spread, disruption-adjusted PD, and recovery floors. Out-of-sample AUC 0.87 at Y−2.
Insurance, pension, SWF, Endowments, and structured-credit applications — Long-duration liability matching under disruption; transition-aligned vs stranded-asset infrastructure debt; manufactured-home and personal-auto disruption mappings.
Methodology
GCA's analytical approach is bottom-up. Each disruption vector — R&D acceleration, VC formation, IPO selection, technology diffusion, incumbent displacement, liability management, and default — is modeled explicitly and translated into security-level inputs: revenue half-life, decay rates, abandonment optionality, intangible amortization, jump-process default intensity. The composite is then aggregated to sector, asset class, and portfolio level.
The output at each layer is analytical (formula-anchored), transparent (every input traceable to a published source), and dynamic (recalibrated quarterly, with intra-quarter event-driven updates when warranted by signal in the disruption pipeline).
Mode of Engagement
Disruption changes daily; static reports go stale. GCA delivers research as a continuous advisory relationship, not a point-in-time opinion.
Quarterly sector calibrations and disruption-pipeline updates.
Bilateral portfolio diagnostics — held privately for each subscribing client.
Custom credit-disruption modeling for new transactions, transitions, or stress events.
Annual Credit Disruption Risk Conference — peer-reviewed research, sponsor presentations, regulator, and academic participation.
Academic partnership — joint research access, internships, and shared data infrastructure.
Who GCA Serves
Asset managers (high yield, leveraged loan, private credit, IG); insurance investment offices and reinsurers; pension plans; CLO managers; rating agencies; sovereign wealth funds; family offices; and academic partners engaged in credit-disruption research. In one sentence: anyone whose fiduciary duty includes credit risk that extends beyond the next two cyclical years.
WHY NOW?
Cyclicality has extended from 5–6 years to roughly 14 years, while disruption cycles run shorter and sharper. Secular variables — innovation, energy, demographics — are now multifactorial, simultaneous, and reinforcing. The frameworks that priced credit in the previous? regime systematically miscalibrate the next decade.
Why Disruption Is the New Beta — and Credit Doesn't Know It Yet
Cyclical frameworks priced beta. Disruption is now a market factor that runs from macro to security. Equity figured this out five years ago. Credit is catching up.
TL;DR
Three secular forces — innovation acceleration, energy transition, and demographic inflection — are simultaneous, non-linear, and reinforcing. Together they have shifted the empirical landscape that credit models were calibrated for: cycles are now ~14 years (vs. 5–6 historically); risk distribution has gone from approximately normal to bimodal; the security market line is convex, not linear; and disruption-driven distress unfolds over 3+ years, not 12–18 months. The result is a structural mispricing of 100–250 bps in disrupted-sector HY, and a sector-correlation regime that breaks every diversification model built on pre-2020 data. Credit needs to add disruption as a sixth factor — the same way equity did.
The Setup: Cyclical Worked for Forty Years
For most of the post-war period, credit pricing was a story about cyclical beta. Risk was a market factor. Risk was approximately normally distributed. Risk premia were stable across regimes. The security market line was upward-sloping and monotonic. Diversification worked because cross-sector correlations were low (0.10–0.20 typical). Defaults were a tail draw from a known distribution. Pre-2010 frameworks — KMV/Merton (1974), Altman Z-Score (1968), Gordon-growth DCF (1959) — captured that world well.
That world is over.
Three Structural Shifts
Three secular forces have become simultaneous and reinforcing. Each is individually familiar to readers; the combination is what's new — and what's underpriced in credit.
Innovation acceleration. R&D, VC, M&A, and IPO volumes have reached historically unprecedented levels. AI, autonomy, robotics, biotech, and pharma are all in non-linear adoption curves simultaneously — that simultaneity is the new variable.
Energy transition. The largest infrastructure rotation since electrification is unfolding in 15 years, not 50. Capacity destruction in legacy generation runs in parallel with capacity formation in transition assets — and the credit profiles of each look nothing alike.
Demographic inflection. Population dynamics in major economies (US, EU, China, Japan) have shifted from binomial growth toward a power-law distribution of regional outcomes. Workforce, consumer, and savings-pool dynamics no longer follow the smooth gradients credit cycles assumed.
What the Empirical Record Shows
Cycles have tripled in length
US economic expansions have stretched from ~5 years (1950s–1970s average) to ~14 years (post-2009). Cyclical frameworks built on shorter cycles now miscalibrate both the timing and the magnitude of stress. The 2020 COVID recession reset the clock — but the underlying secular extension is structural, not pandemic-driven.
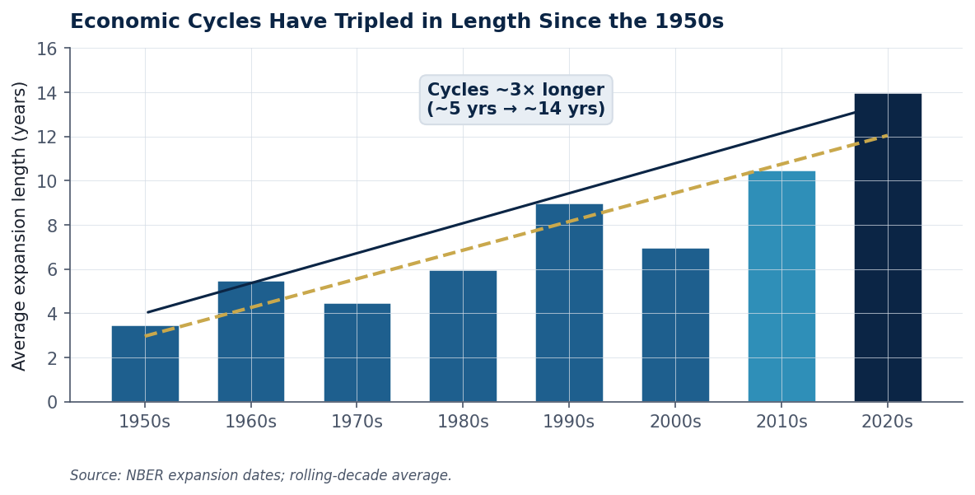
Figure 2 · US expansion length by decade. Trend is roughly 3× longer.
Risk distribution is now bimodal
When sectors rotate from cyclical perturbation to structural transformation, the return distribution stops being normal. One mode emerges in the right tail (disruptors capturing displaced revenue at high margins); another mode emerges in the left tail (disrupted incumbents facing terminal-value collapse). The middle thins out — which is exactly where most credit portfolios sit. The Russell 1000 has ~25% disrupted weight; the Wilshire 5000 has 16% disrupted with another 50% neutral. HY sub-indices carry materially more (ICE BofA HY ~32% disrupted by par-weighted exposure).
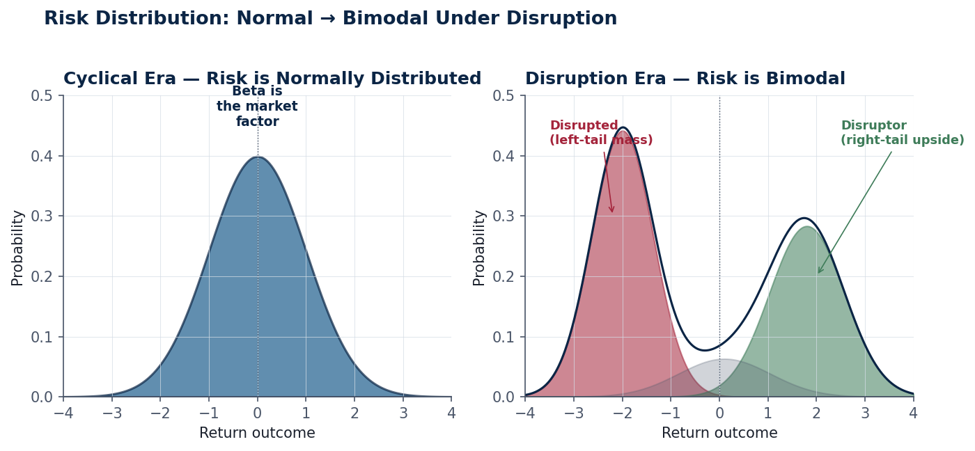
Figure 3 · The shift from normal to bimodal. Cyclical models assume the left panel. The data look like the right.
The security market line is convex
Under cyclical beta, higher systematic risk earns a stable premium and the security market line is linear and upward-sloping. Under disruption, the SML curves. In the disrupted segment, higher beta correlates with worse — not better — expected return: the long-duration disrupted incumbent is the worst place to be on a risk-adjusted basis, even though it screens as 'cheap' on legacy spread metrics. Disruptor equity sits above the cyclical SML; disrupted credit sits well below it.
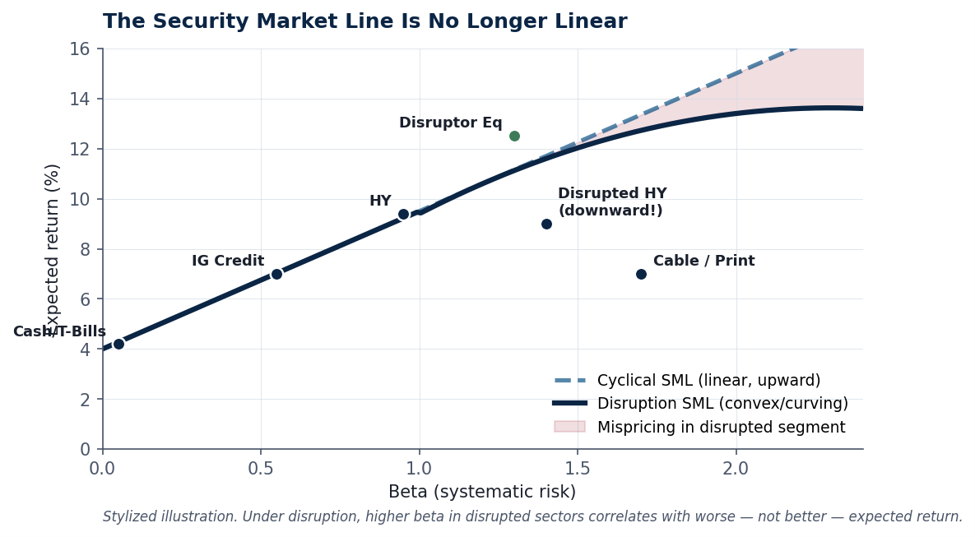
Figure 4 · Cyclical SML (linear) vs disruption SML (convex, curving). The shaded region is structural mispricing.
Detection runs on a different clock
Cyclical credit stress is a 12–18 month event: leverage builds, refinancing cost rises, a downgrade triggers covenant action, default follows. Disruption-driven distress runs on a ~3.5 year clock — signal emergence, revenue decay, zombie/restructuring, default. Frameworks calibrated to the cyclical clock arrive years late. The architectural difference is detection lead time: a disruption-aware framework can flag a name 2+ years before legacy leverage signals fire.
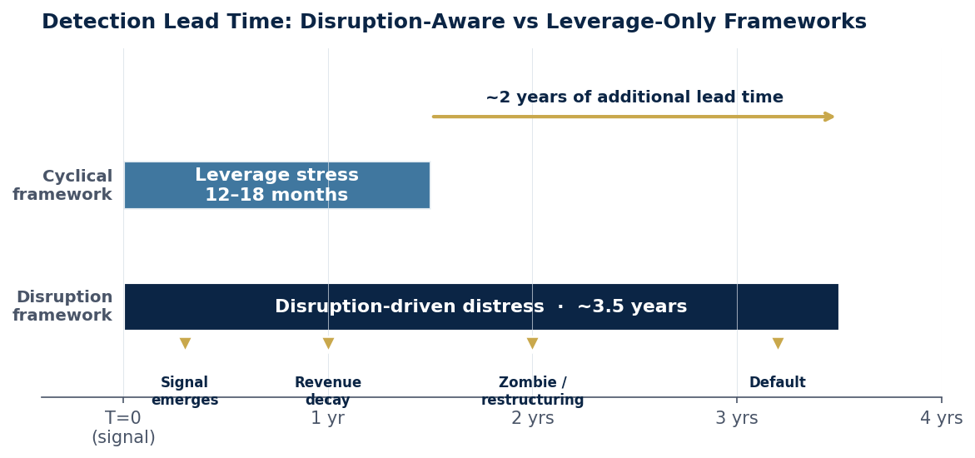
Figure 5 · Disruption-aware frameworks flag stress 2+ years earlier than leverage-only frameworks.
The GDP arithmetic — net 5%, gross 25%
By 2035, US GDP shows a 15% / -10% / 5% decomposition: roughly 15% of nominal GDP created by innovation (new sectors, AI-enabled productivity, transition infrastructure), 10% destroyed by displacement (legacy incumbents, stranded assets, displaced services), netting to 5% real growth. The net number understates the underlying credit-risk shift by an order of magnitude: it is the gross rotation, not the net result, that determines default rates, recovery rates, and sector correlations.
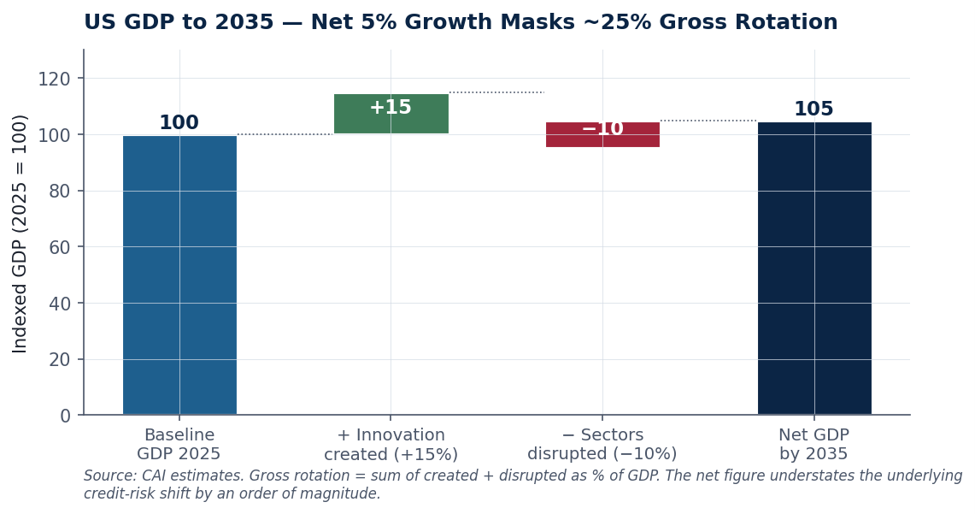
Figure 6 · The net-5% headline hides ~25% of GDP rotating between disruptor and disrupted activity.
Index exposure — credit carries more
A frequent misreading is that disruption is an equity-index phenomenon. The data say the opposite for credit: HY and leveraged-loan indices carry systematically higher disrupted-sector exposure than broad equity indices, because mature, levered, cash-flow-paying issuers cluster in exactly the sectors most vulnerable to displacement (cable, legacy telecom, traditional power, parts of retail, integrated steel, print media).
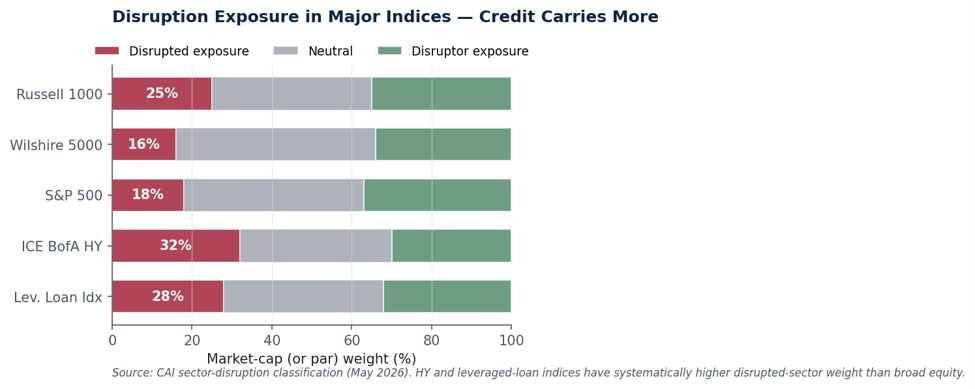
Figure 7 · HY and leveraged-loan indices carry 28–32% disrupted exposure vs 16–25% in broad equity.
Estimated US dollar exposure: disrupted-sector equity ~$8.3T, disrupted-sector debt ~$3.0T. If structural default rates in disrupted HY converge to 8% — not as a cyclical spike but as a baseline — the present-value implication for credit portfolios is materially larger than the equity index figures suggest.
Why Credit Hasn't Repriced — Yet
Equity factor models have already moved. The Fama-French 5-factor model (beta, size, value, momentum, profitability) is now routinely extended to six factors with the addition of disruption. Credit has not made that move. Several structural reasons:
Reported EBITDA captures cash flow today, not the displacement curve tomorrow. Disrupted incumbents typically have strong trailing cash flow right up to the cliff.
WACC is calibrated on trailing beta. Disruption volatility — abandonment optionality, intangible decay, regulatory jumps — is invisible in the historical covariance matrix.
Terminal value compounds the error. A 1% shift in g moves enterprise value by 30–50%, and 60–80% of mature credit EV sits in the Gordon perpetuity.
CECL and IFRS 9 lifetime PD are calibrated on cyclical data. Disruption-adjusted PD is not yet a standard sensitivity in ECL provisioning.
Covenant packages don't specify which EBITDA. Reported EBITDA vs disruption-adjusted EBITDA (after the f reduction factor) can diverge by 30%+ for disrupted issuers — and lender protection depends on which definition governs.
Implications Across the Decision Stack
Disruption is not a sector overlay or a thematic tilt — it propagates through every layer of the credit decision stack:
Asset allocation
Cash and short sovereigns regain a strategic role they have not had since the late 1990s — they are the only assets that survive a disruption-driven correlation breakdown.
HY, private credit, IG, and leveraged loan allocations need active sector rotation, not market-cap-weighted exposure: long disruptor / short disrupted within tech, energy, and media.
Expected returns/ volatility/correlation by asset class should be sensitized to disruption from innovation, energy transition, and demographic shifts, all of which can have a significant impact
Risk management
Tail VaR is understated by 30–80% under cyclical calibration. Apply a disruption-correlation overlay.
CLO tranching protection erodes when sector correlation runs 0.35–0.55 — the disruption regime — rather than the 0.10–0.20 cyclical baseline.
Stress scenarios must include jump-process risks (carbon-price spike, AI Act enforcement, technology cliffs) that historical drawdowns alone cannot calibrate.
Individual security pricing
Shorter assumed average life — bonds priced correctly at issuance become structurally mispriced before maturity when time elapses past T_cliff.
Abandonment optionality persists in equity even when debt trades at 65 cents. The cleanest disruption trade is long distressed/short equity — not the reverse.
Disruptors are credit risks too. AI infrastructure HY underwritten on enterprise value (option value) can still fail coverage on operating EBITDA at 1.5×. Covenant specification matters as much as security selection.
Who Should Care
If you allocate to or manage credit — leveraged loans, high yield, private credit, IG, CLOs, infrastructure debt, EM credit, and your framework prices cyclical beta but not disruption beta, you are systematically mispricing the middle of your book. The mispricing is largest in B/BB/BBB names and middle CLO tranches, not in the names that look obviously distressed. If you run an insurance balance sheet, pension portfolio, or sovereign asset book, your duration is exposed to a structural impairment process that the actuarial models have not internalized. If you sit at a rating agency or regulator, the historical default series you calibrate against is now non-stationary in a way that pre-2020 stationarity tests cannot detect.
Conclusion — and Five Surprises
The transition is not from one cycle to the next. It is from cyclical analytics to secular analytics. Disruption is a market factor — it impacts the full decision stack from macroeconomic forecast to security-level risk and hence covenant design. Equity is roughly five years ahead of credit in absorbing this. The catch-up will not be smooth.
Five findings from GCA's working composite that often surprise practitioners on first exposure:
The largest mispricing is in the middle, not in the tails. B/BB/BBB names carry the most unpriced disruption risk — the obviously distressed names are already correctly priced.
Distressed debt can outperform short equity in disrupted sectors. Abandonment optionality creates an equity floor even when debt trades at 65 cents.
Disruptors are credit risks too. EV-based underwriting hides operating-EBITDA fragility. Covenant design — which EBITDA governs — is the new structural question.
Sector diversification stops hedging idiosyncratic risk. Disruption is parallel across sectors, not idiosyncratic within them. A 'diversified' credit portfolio under disruption may not be diversified at all.
Cash and short sovereigns regain a strategic role they have not had in twenty-five years. They are the only assets that survive a disruption-driven correlation breakdown.
HOW TO ENGAGE
Global Credit Analysis publishes quarterly sector calibrations, hosts the annual Credit Disruption Risk Conference, and runs bilateral portfolio diagnostics for institutional clients. Academic partnership inquiries and subscription requests can be directed to our form here